A Multi-Stable Curved Line Shape Display
Wing-Sum Law, Sofia Wyetzner, Raymond Zhen, and Sean Follmer
Paper
| ICRA 2024
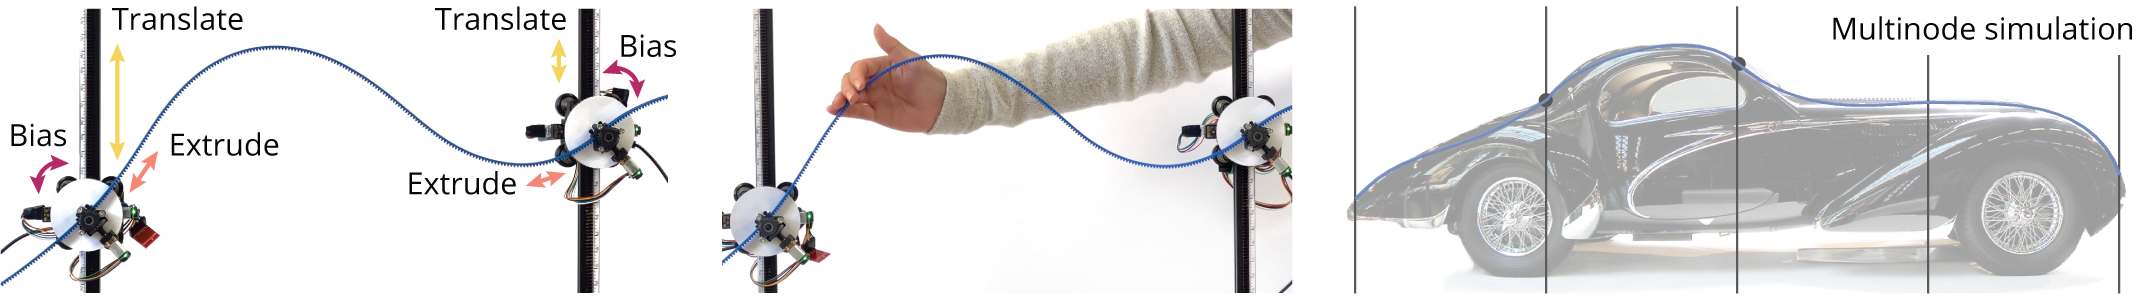
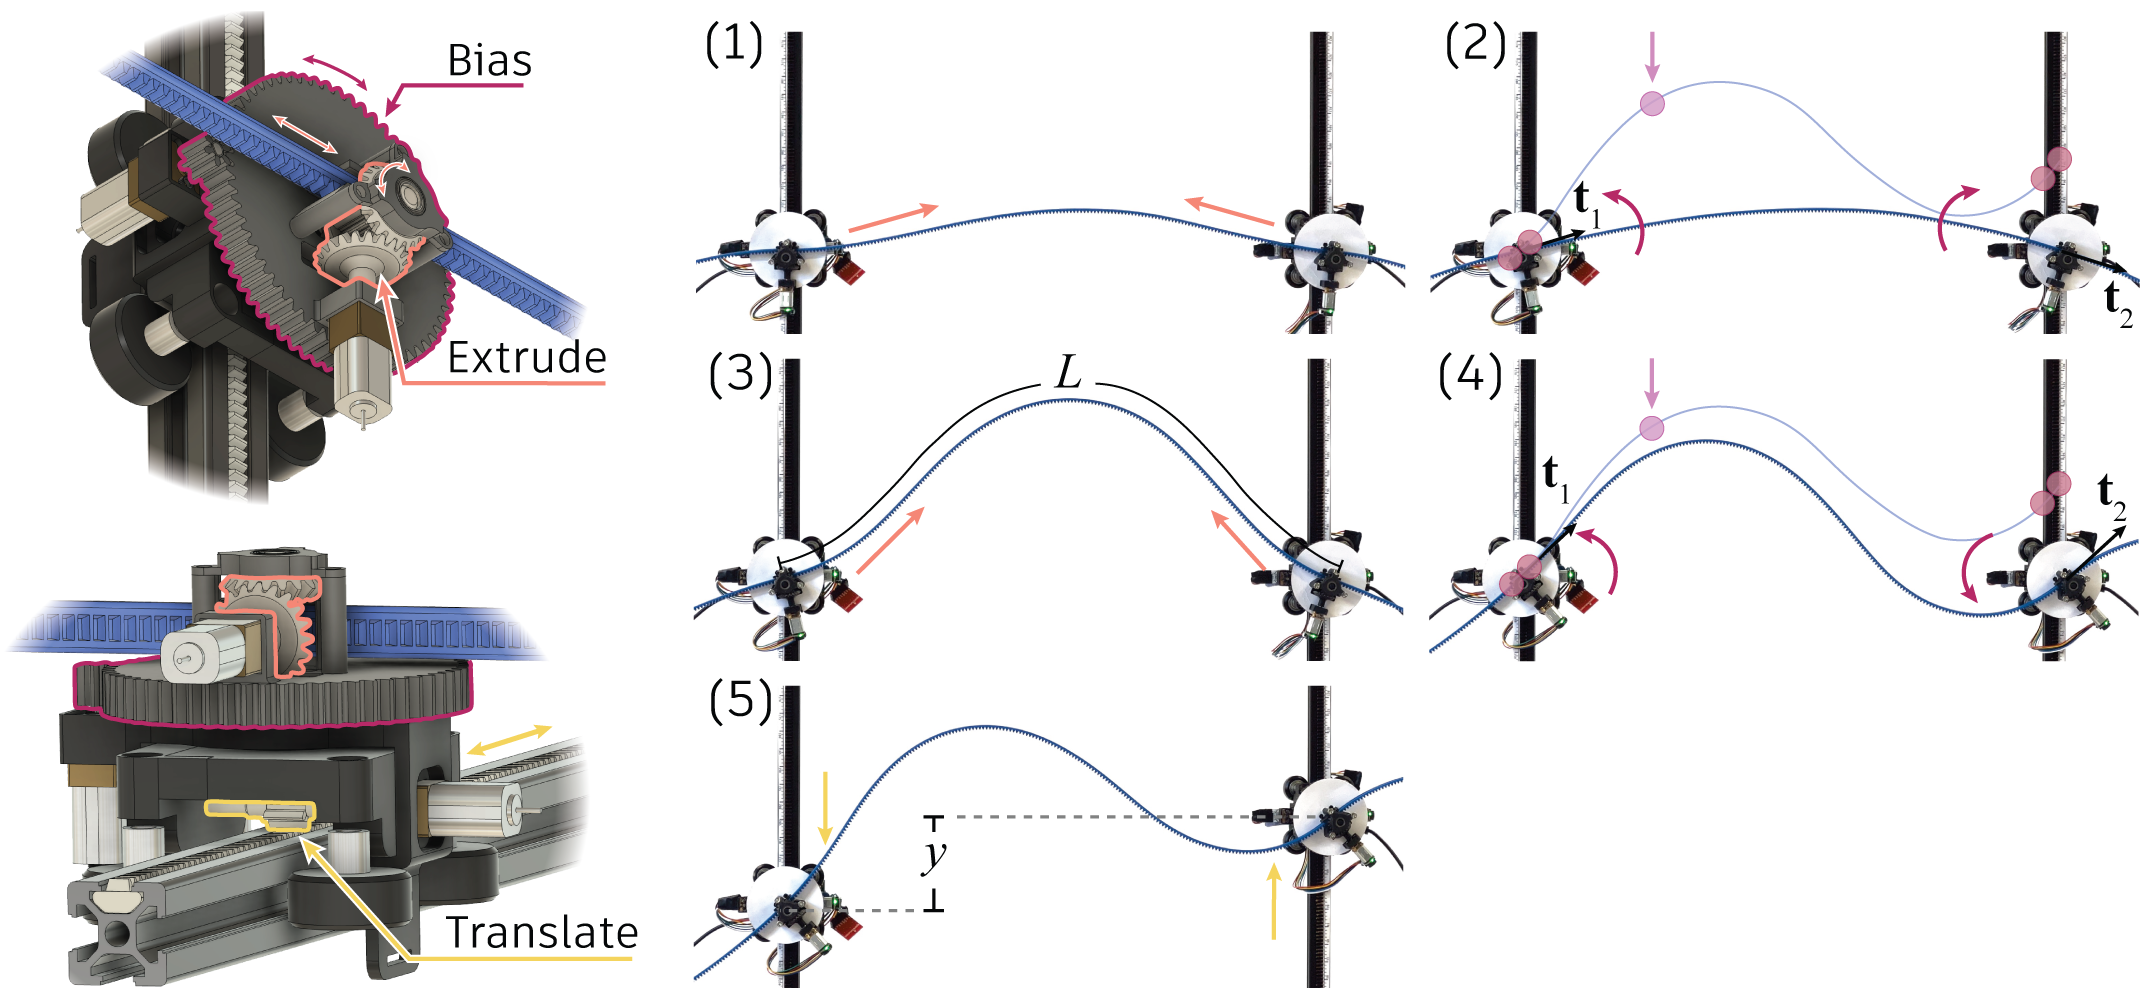
In this work, we present a multi-stable curved line shape display, with which we are able to display high curvature, smooth shapes by bending the ends of a flexible rod. We used a discrete elastic rods simulation to inform our actuation strategy, and demonstrated the display's ability to display a variety of shapes consistent with simulation results.
Curved lines are present in many designs, but are difficult to represent on shape-changing displays. One way to overcome this limitation is by bending smooth, flexible materials. Due to system multi-stability, we model the system and determine the actuation method using separate initializations for a discrete elastic rods model (M. Bergou et al. 2008).
Over a total of 16 different shapes, the overall mean standard deviation within N = 3 trials over all 16 shapes of 0.75 mm (0.47% of the display’s maximum vertical range). These results show that our curved line display can consistently generate the same shape given the same actuation instructions over a variety of different shapes. For nearly all of the shapes, there is good agreement between the simulation and the physical display. Excluding the two shapes marked with **, the mean RMSE between the height physical display and our model was 6.68 mm (3.85% of the display’s maximum vertical range).
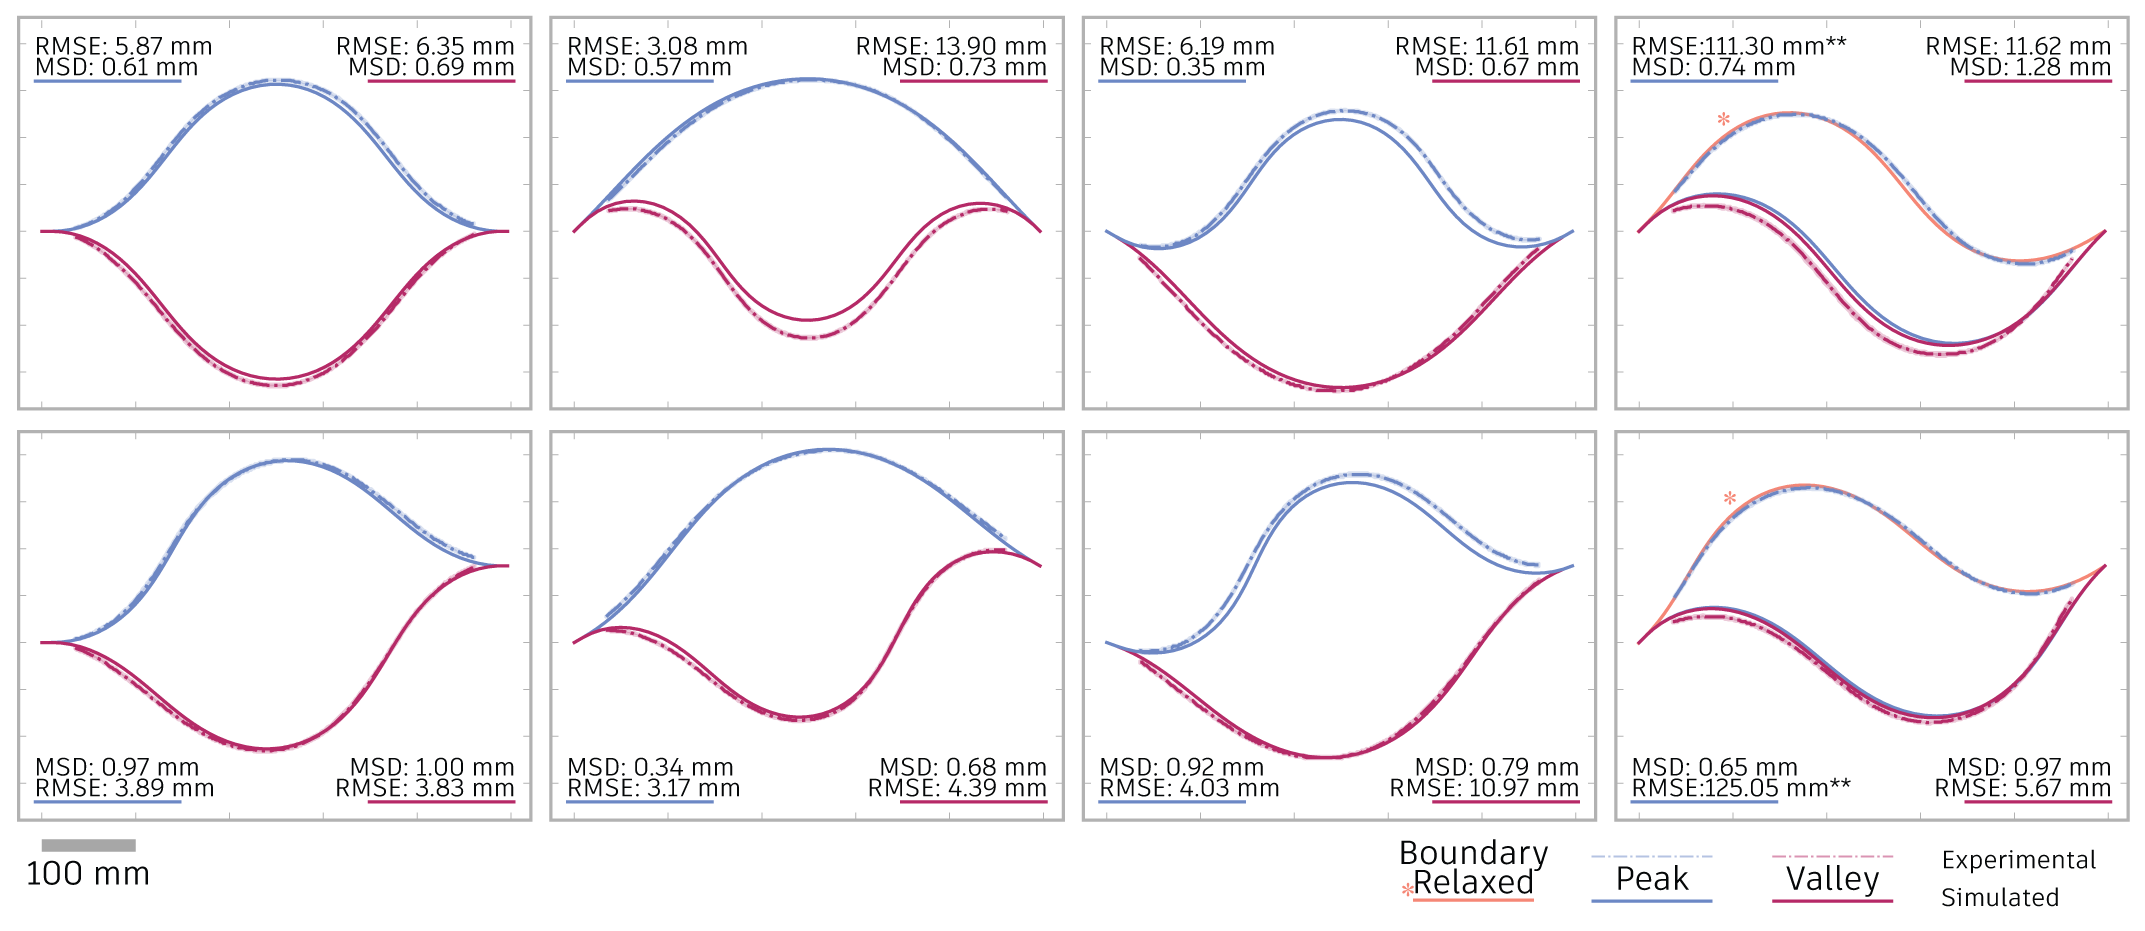
We were unable to match the physical display for the two shapes marked with **. Both of these shapes had a stable “peak” shape on the physical display, but when we simulated the display using those boundary conditions, the final shape collapsed into the other stable configuration. If the rightmost boundary condition is allowed to be more horizontal, we can simulate a shape with better agreement with the physical system (curves marked with * in the rightmost column of the figure below). We hypothesize that the discrepancy between the physical display and the simulation is due to some unintended compliance in the system.
The poster we presented at ICRA 2024: