Conveying Shape Characteristics
Danyang Fan, Alexa Fay Siu, Wing-Sum Law, Raymond Zhen, Sile O'Modhrain, and Sean Follmer
Paper
| CHI 2022
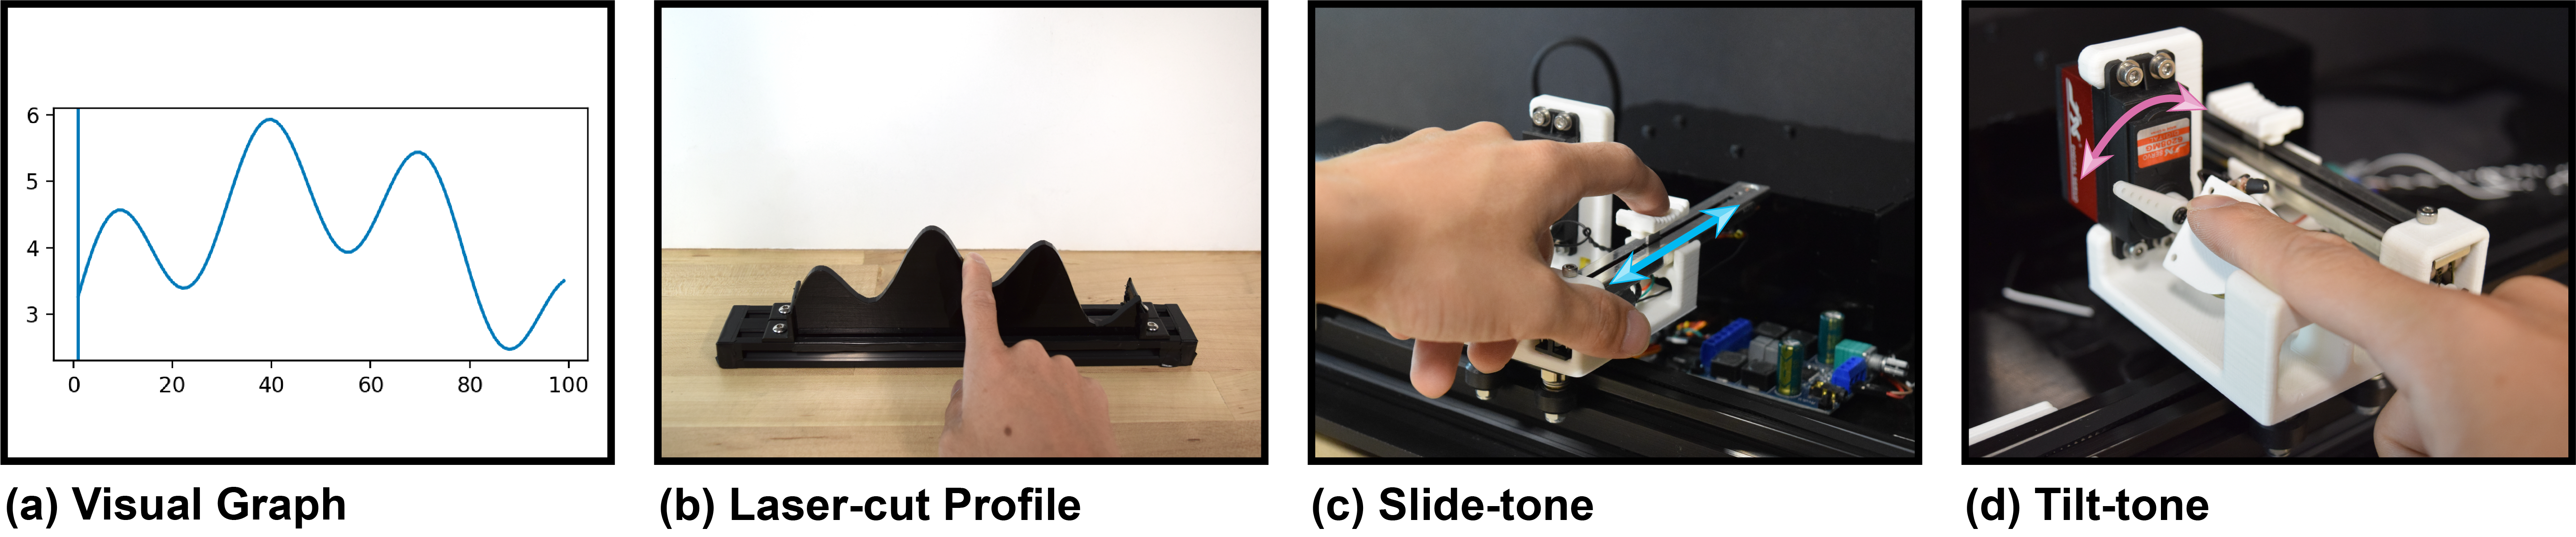
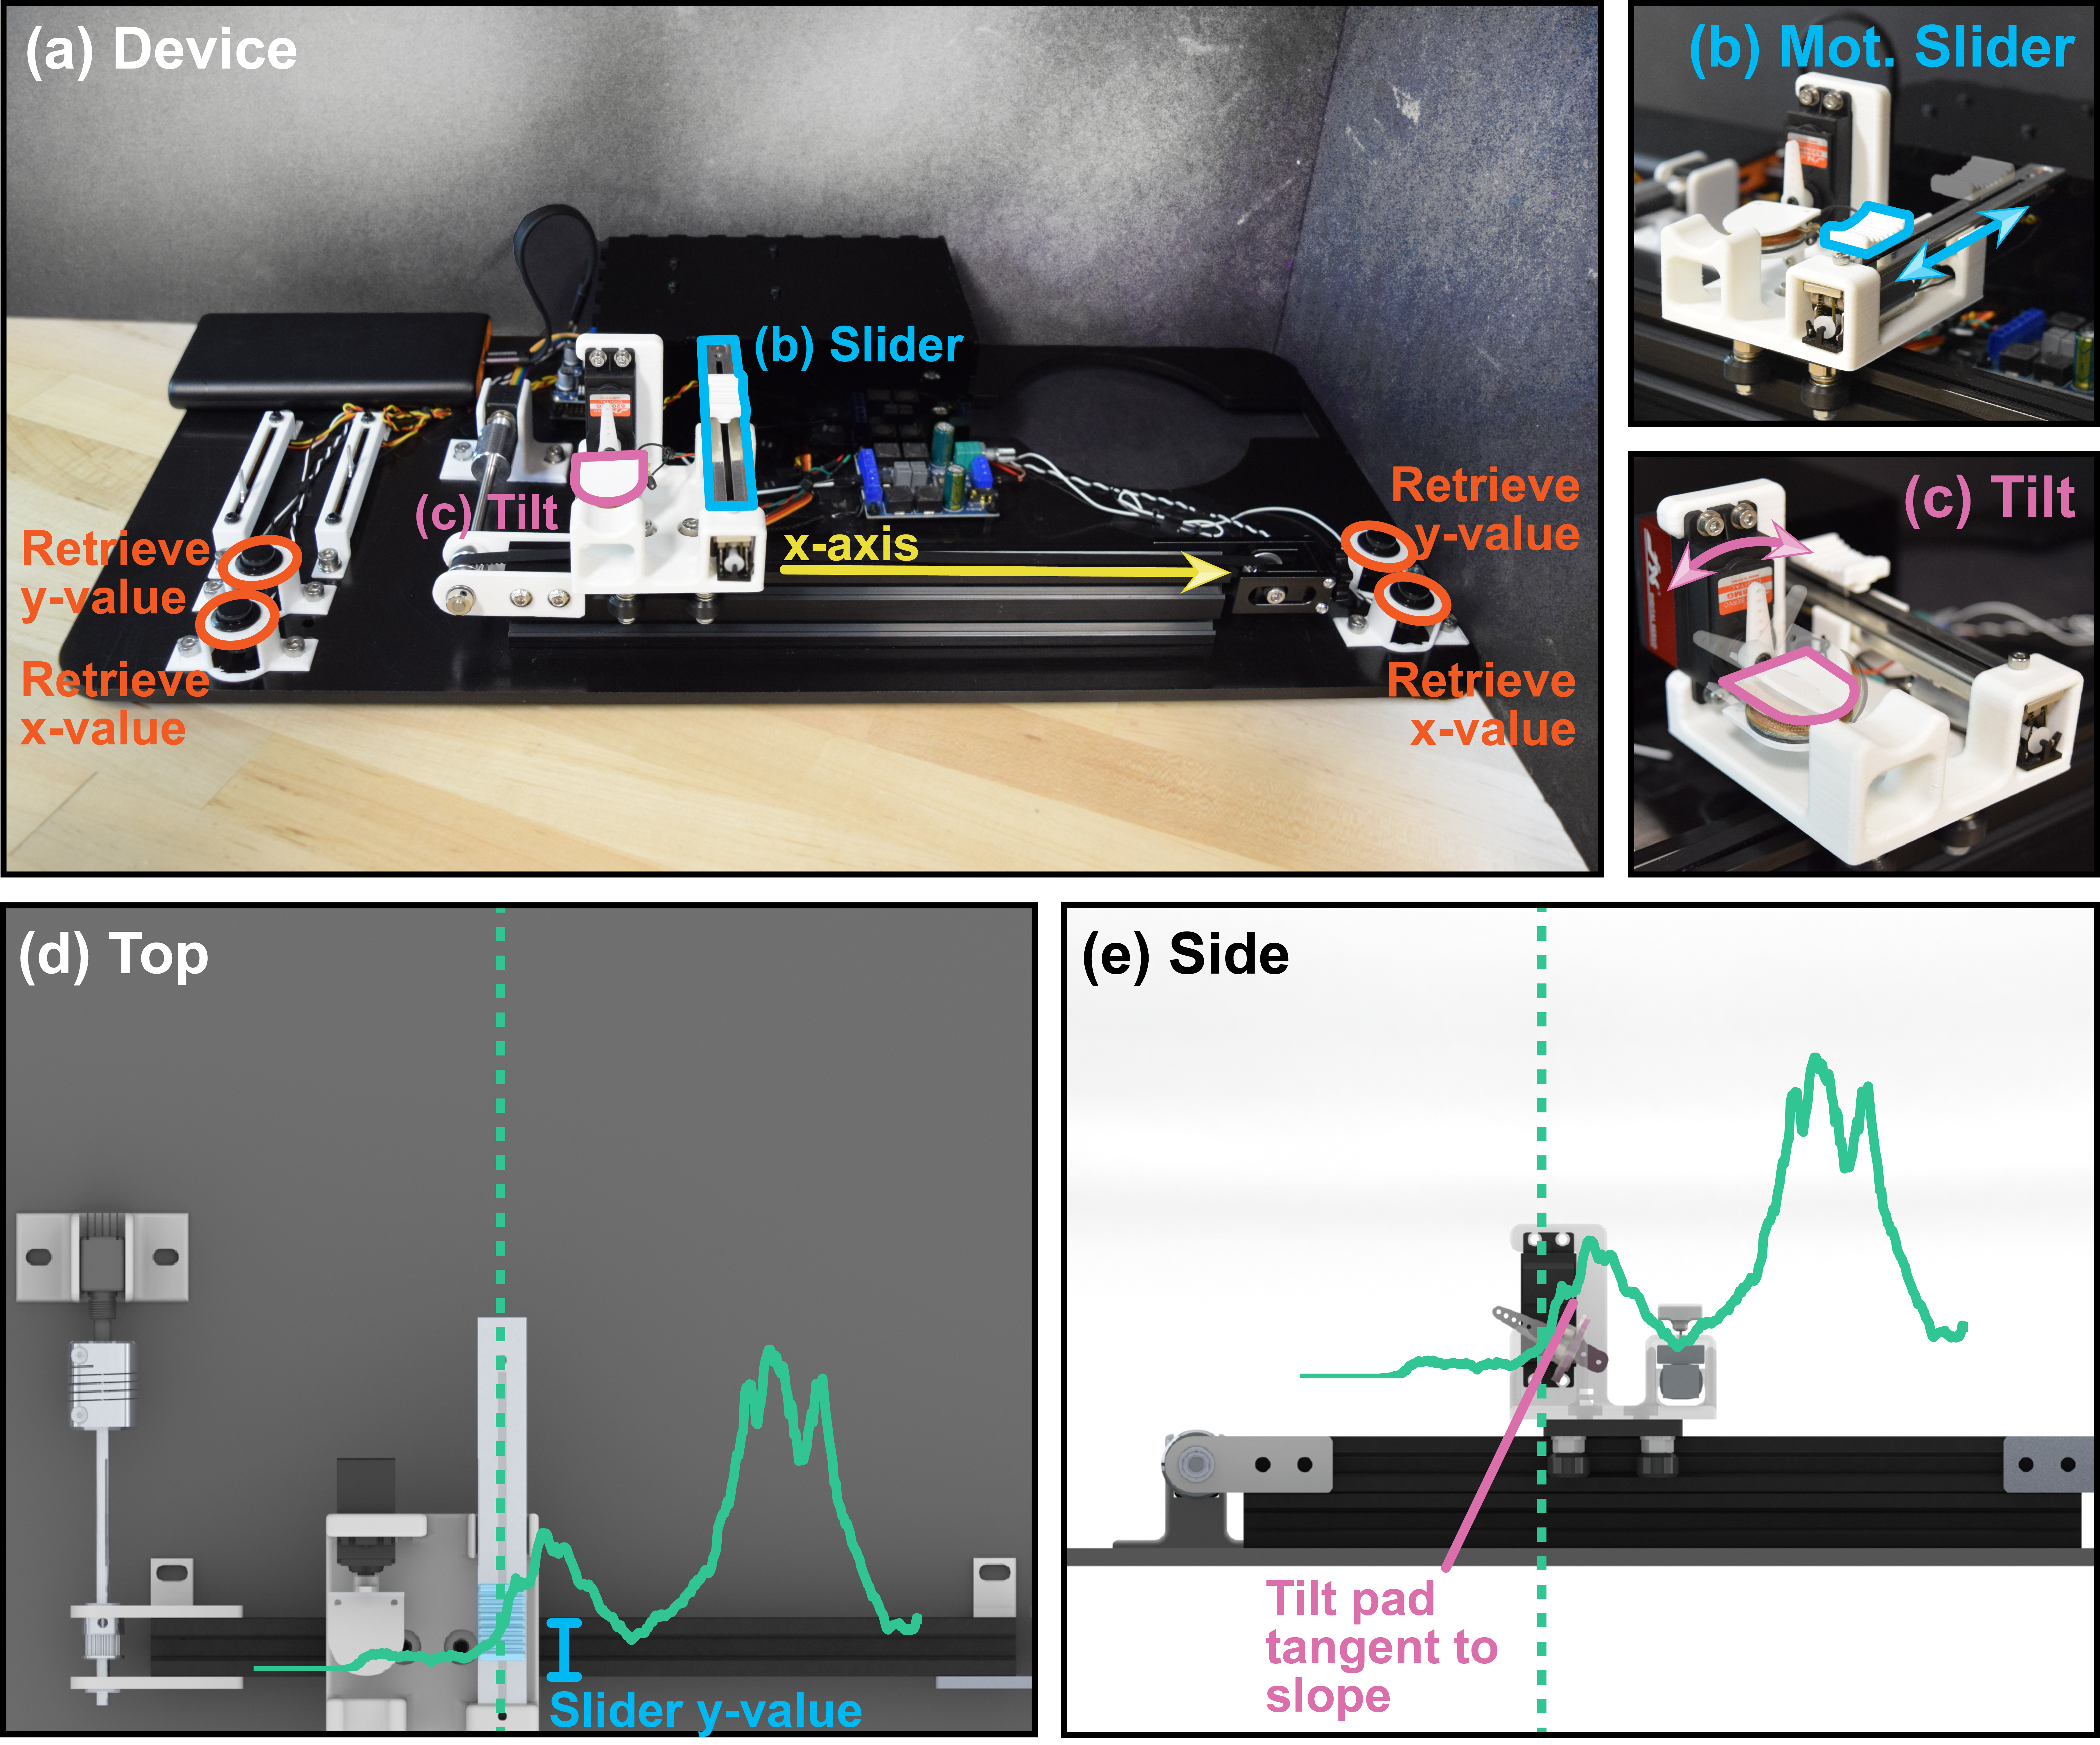
More and more, we all interact with data-driven graphs to understand our environments and current events. However, information that is conveyed only visually is inaccessible to blind and visually impaired users. Some alternatives exist, but they are often non-refreshable or prohibitively expensive. We attempt to address this through a 1-DOF haptic device.
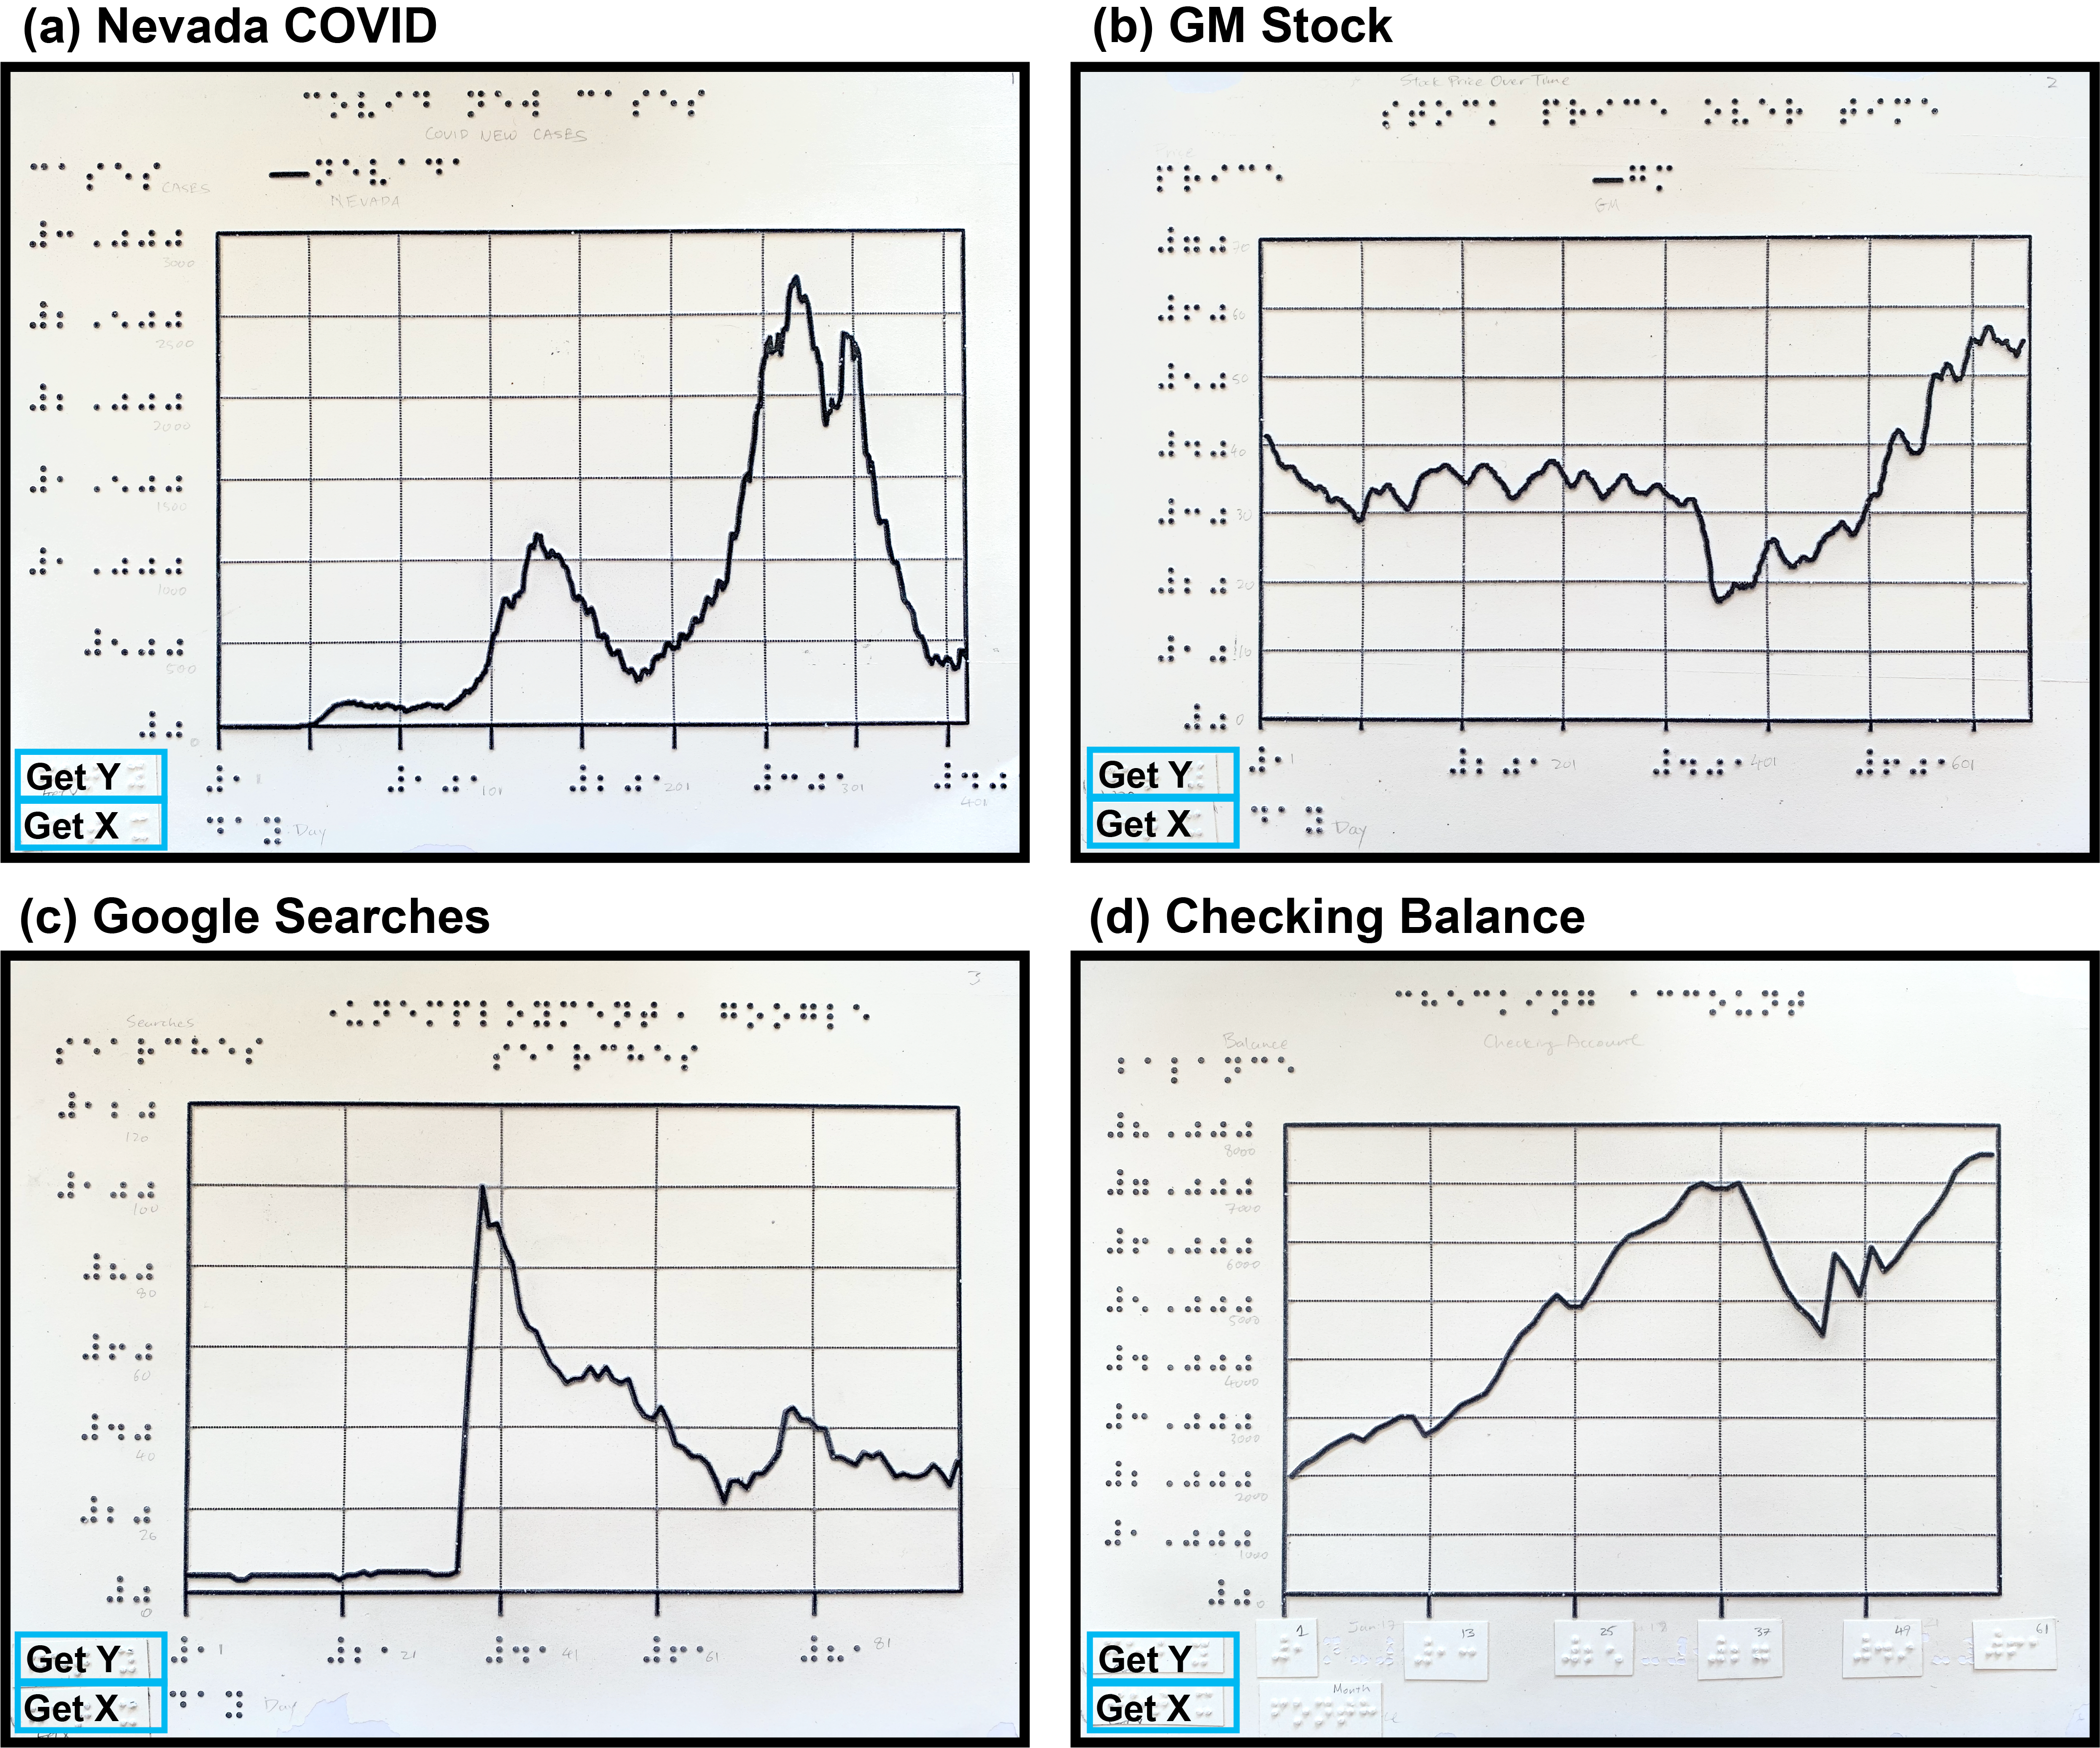
For this project, I developed an interactive tactile graphic with audio feedback using Unity for comparison with novel 1-DOF haptic device for conveying shape of graphs to blind or visually impaired users. The Unity application was run on a tablet underneath tactile graphics such as the ones shown below, and would use speech-to-text to read aloud the labels on the figures, as well as the x- and y-values of the graphics when a user pressed the corresponding button.